Cyber cat modeling built on real companies.
Not hypothetical scenarios.
Cyberwrite simulates 50,000 stochastic cyber events across a 250,000-year horizon, grounded in granular, company-level data: technology dependencies, security posture, and digital supply chains. Built on the OASIS Loss Modelling Framework, ingesting OED and outputting ORD. Fully simulation-based, with every individual simulation accessible in the output.
50K
Stochastic events
250K
Year horizon
320M+
Companies modeled
100%
Sim transparency
Scenarios describe possibilities. Our data reveals actual exposure.
Traditional scenario-only models
- Static scenario libraries that reflect the threat landscape at model build time, not today.
- Assumed dependency distributions (e.g. assumed 30% AWS usage when actual is 55%).
- No company-level resolution, only portfolio-level estimates.
Cyberwrite data-first approach
- Continuous scanning of 320M+ companies for actual technology stack and cloud dependencies.
- Real, observed security posture per company.
- 50,000 stochastic events across a 250,000-year horizon propagated through real dependency chains.
- Company-level loss attribution showing which policies drive each return period.
The scenarios are the same. The difference is the data underneath, and that data is ours.
Event-based. Data-driven. Company-level resolution.
Real Company Data Foundation
Every company in your portfolio is assessed using continuously updated data intelligence: actual technology dependencies, cloud providers, software platforms, security posture, and historical vulnerability patterns across 320M+ organizations.
Frequency Pillar: Event Generation
A stochastic catalogue of 50,000 events is generated across a 250,000-year horizon with 75 sample slots per year (~18.75M scenarios). Frequency is anchored to a 1-in-5-year (0.20/yr) baseline calibrated to historical catastrophes including NotPetya (2017), WannaCry (2017), the CrowdStrike incident (2024), and CDK Global (2024). Each event is parametrised on three orthogonal dimensions (Propagation x Impact x Intensity), with an exclusion matrix that retains the seven valid Propagation x Impact combinations.
Co-Exposure Pillar: Affinity Propagation
When an event triggers, the model resolves affected companies via shared affinities (~25 affinities per event), not assumed industry sectors. Affinity-based co-exposure replaces the peril-based framing used in natural-catastrophe models, reflecting how cyber correlation actually propagates: through shared technology stacks. A catastrophe trigger is defined as containment failure across multiple insureds in a shared affinity, exceeding a frequency or correlation threshold.
Severity and Financial Pillar: Loss Calculation
Per-company severity follows a scaled Beta model: L = M*X with X ~ Beta(alpha, beta), where M is the maximum exposure and the Beta shape parameters are calibrated by coverage and segment. Financial losses are derived from revenue, business interruption profile, coverage structure, and claims-history analogs. Inherent frequency is attenuated to residual frequency by the company-specific control posture, avoiding double-counting of controls already captured in the single-risk model.
Cyberwrite AI Synthesis & OASIS-LMF Outputs
Cyberwrite AI summarises results in natural language, identifying top contributing events, most vulnerable segments, and specific actions to reduce tail exposure. Outputs are produced in OASIS-LMF compatible OED/ORD format for direct ingestion into reinsurer pricing and capital workflows.
Reinsurer-Ready Analytics. Powered by Real Data.
Exceedance probability curves, loss distribution tables, and Cyberwrite AI portfolio insights — delivered in seconds, grounded in actual company dependency data.
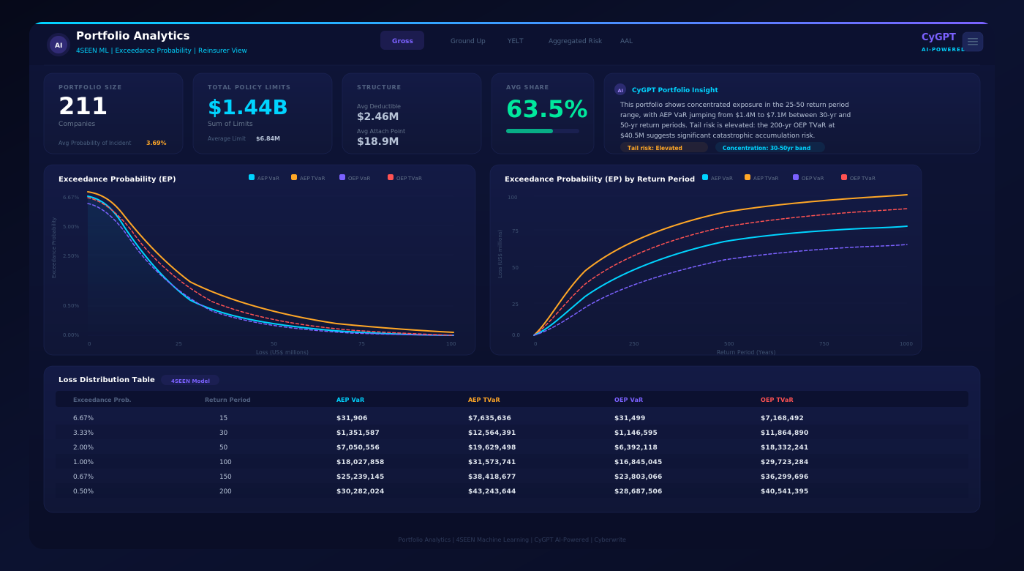 Cyberwrite AICyberwrite AI Portfolio InsightPortfolio Analytics | 4SEEN Machine Learning | Cyberwrite AI-powered | Cyberwrite
Model output specifications.
Occurrence Exceedance Probability (OEP) curves: portfolio occurrence loss across return periods
Aggregate Exceedance Probability (AEP) curves: portfolio aggregate loss across return periods
Average Annual Loss (AAL) and Tail Value at Risk (TVaR): capital adequacy and treaty pricing inputs
Event Loss Tables (ELT) and Period Loss Tables (PLT): OASIS-LMF compatible OED/ORD outputs
Per-risk severity curves: return periods from 1-in-10 to 1-in-100,000 at the single-company level
Portfolio return periods reported on the 1-in-10 to 1-in-250 range, consistent with the Cyber Risk Analytics view
Company-level attribution: which policies drive loss at each return period
Dependency concentration analysis: exposure to specific cloud providers and vendors
Cyberwrite AI narrative: natural-language summaries for non-technical stakeholders
How Cyberwrite compares.
| Feature | Cyberwrite | Scenario-Only Models |
|---|---|---|
| Data foundation | Real company data (320M+ organizations) | Assumed industry distributions |
| Event set | 50,000 stochastic events x 250,000-year horizon (~18.75M scenarios) | Hundreds to low thousands of synthetic scenarios |
| Co-exposure framing | Affinity-based (~25 affinities per event) | Peril-based or assumed industry sectors |
| Company-level resolution | Per-policy loss attribution | Portfolio-level aggregates only |
| Update frequency | Continuously updated | Annual or semi-annual model releases |
| OASIS-LMF compliance | Outputs in OED/ORD format | Vendor-specific formats |
| Frequency calibration | 1-in-5-year (0.20/yr) baseline calibrated to NotPetya, WannaCry, CrowdStrike, CDK Global | Expert-elicited, scenario-only |
| Severity model | Per-company scaled Beta: L = M*X, X ~ Beta(alpha, beta) | Industry multipliers |
| LLM-powered narrative | Cyberwrite AI synthesis | Manual actuarial interpretation |
| Transparency | Full event-to-loss traceability | Limited methodology disclosure |
Cyberwrite enables the collection and analysis of critical real-world data to quantify catastrophe exposure across entire books of business, delivering real-time, on-demand insights into systemic cyber risk.
Sie Lau
Head of Cyber Insurance, Samsung