Understanding Exceedance Probability (EP) Curves in Catastrophe Modeling
By the Cyberwrite Research Team
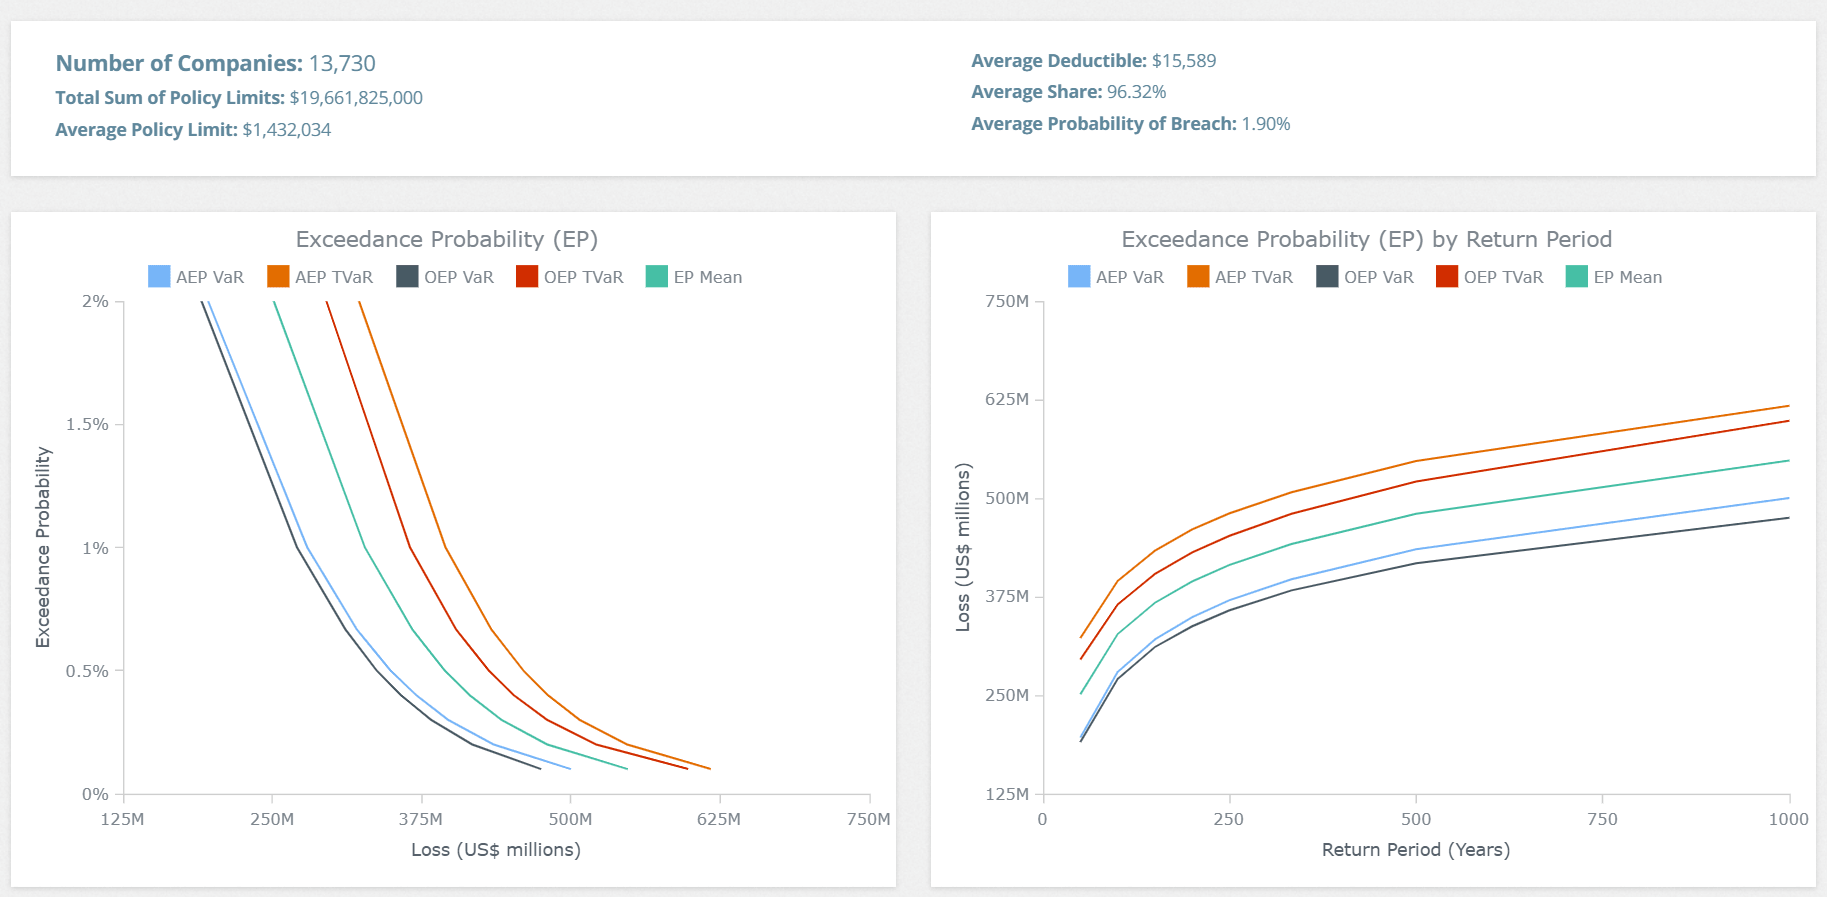
In the field of catastrophe risk modeling, understanding potential financial impacts from rare, high-severity events is essential for insurers, reinsurers, and risk managers. One of the most valuable tools for visualizing and interpreting this risk is the Exceedance Probability (EP) curve.
What is an EP Curve?
An EP (Exceedance Probability) curve provides a visual representation of the probability that losses will exceed various thresholds within a defined period, such as a year. The curve answers the fundamental question: "What is the likelihood that a certain loss level will be exceeded?"
In the chart, the X-axis represents loss values (often measured in millions of dollars), while the Y-axis shows the probability that the specified loss threshold will be exceeded in a given time frame.
Key Metrics: AEP and OEP, VaR and TVaR
EP curves are often broken down into two types of probabilities — AEP (Aggregate Exceedance Probability) and OEP (Occurrence Exceedance Probability) — and two measures of risk exposure — VaR (Value at Risk) and TVaR (Tail Value at Risk).
- Aggregate Exceedance Probability (AEP): Reflects the probability that the total losses from multiple events in a specified time frame will exceed a given threshold. Useful for assessing cumulative impact across a policy year.
- Occurrence Exceedance Probability (OEP): Measures the probability that a single event will produce losses above a specified threshold. Essential for evaluating individual high-impact events like a major ransomware campaign.
- Value at Risk (VaR): The maximum loss expected at a specified probability level. If VaR at 1% is $1M, there's a 1% chance losses will exceed $1M in a given period.
- Tail Value at Risk (TVaR): Calculates the average loss for scenarios where the loss exceeds the VaR threshold — focusing on extreme outcomes critical in catastrophe modeling.
How to Interpret an EP Curve
AEP and OEP curves together give insurers a full picture of their exposure. AEP is particularly useful for reinsurance treaty structuring, while OEP helps with individual event scenarios. The TVaR lines highlight expected losses in the tail — the scenarios that matter most to capital allocation and solvency.
Practical Application for Cyber Insurers
EP curves enable cyber insurers to communicate risk in a standardized, actuarially rigorous way. Cyberwrite's catastrophe modeling platform produces AEP and OEP curves calibrated against real company dependency data — making the outputs significantly more precise than scenario-only approaches. Rather than relying on assumed distributions, our model uses actual technology stacks and digital supply chains of each insured to generate loss curves that reflect true portfolio exposure.
Conclusion
Exceedance Probability curves are an indispensable tool for cyber risk quantification. As cyber catastrophe modeling matures, EP curves built on real data will become standard in reinsurance negotiations, ILS structuring, and regulatory capital reporting. Cyberwrite is at the forefront of this shift — delivering insurance-grade EP analytics backed by proprietary data from 320M+ companies.